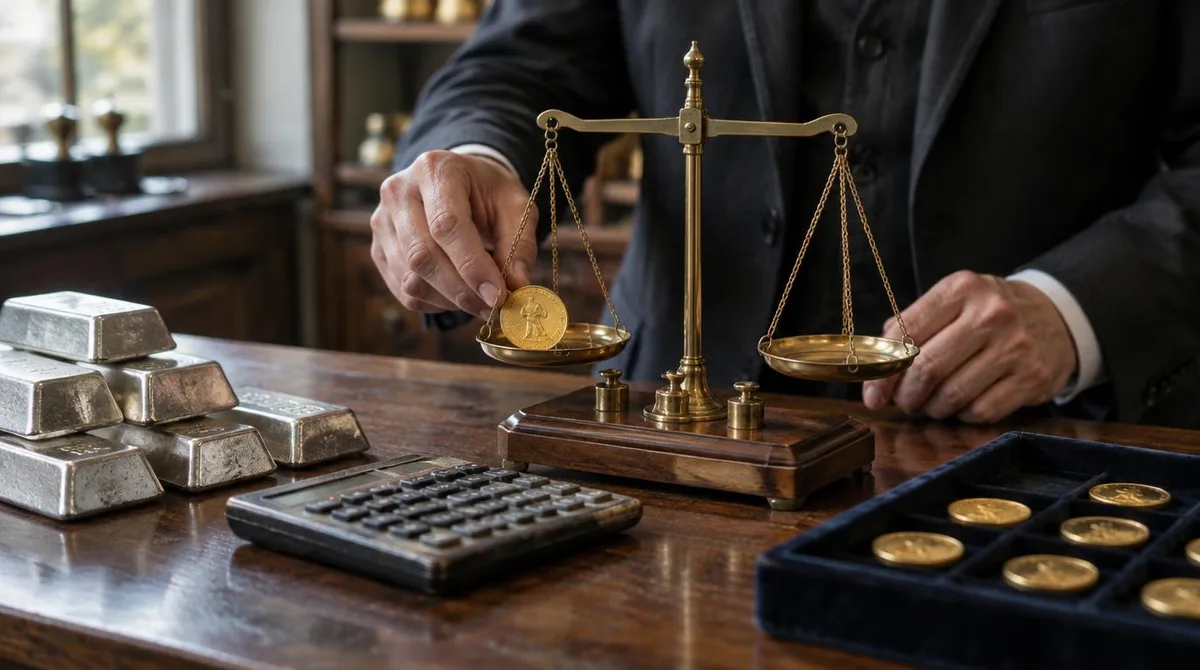

Any silver price prediction for the next 5 years is not a forecast of the metal. It is a forecast of a handful of inputs: real interest rates, the dollar, industrial demand, and mine supply. Change those inputs and the output changes with them. That is why long-horizon silver outlooks diverge so widely, and why reading them well means reading their assumptions before their numbers.
The starting point matters too. Silver is small and fast. As Kitco notes, the silver market is a fraction of gold's size, so the same flows move it further, and silver routinely outpaces gold in percentage terms in both directions. A five-year projection written in a calm market can look naive after one sharp year.
This article does not offer its own price target. It maps the assumptions behind the targets you will read, so you can judge which ones rest on evidence and which rest on mood.
What the Long-Horizon Forecasts Actually Rest On
Strip a typical five-year silver outlook down and you find three or four load-bearing claims. The first is monetary: that real interest rates stay low enough, or the dollar weak enough, to keep hard assets attractive. The second is industrial: that demand from electronics, electric vehicles and especially solar keeps growing. The third is supply: that mine output responds slowly, because most silver comes out of the ground as a byproduct of mining copper, lead, zinc and gold.
Each claim is defensible. Each can also fail on its own. Rates can rise. A manufacturing downturn can cut industrial demand even while monetary conditions favor gold. And a byproduct supply curve cuts both ways: it limits new mine openings when prices rise, but it also means supply barely falls when prices collapse. A forecast that assumes all three inputs move in silver's favor is not a base case. It is a bull case wearing a base case's clothes. For related coverage, see Silver ETFs vs Physical Silver: What You Actually Own in Each.
Why Silver's Volatility Makes Five-Year Targets Fragile
According to TradingView, silver reached its all-time high of 121.649 USD on Jan 29, 2026, and its all-time low of 8.420 USD on Oct 28, 2008. A metal that has traded between roughly eight and one hundred twenty dollars within a single generation does not lend itself to point forecasts. The honest five-year outlooks acknowledge this by publishing ranges, not numbers.
Volatility is not an accident of silver's character. Kitco's market desk describes it as a defining feature: silver tracks gold's monetary drivers, but its industrial side can pull it lower in sharp downturns even while gold holds firm, as happened in 2008 and March 2020. The same dual identity that makes silver interesting makes any single-path projection unreliable. When an analyst publishes a five-year point target without a range or a scenario table, that is a signal about method, not about conviction.
The Industrial Engine: Solar, Electronics and the Cycle
Silver's second engine is the one gold lacks. More than half of annual silver demand is industrial, and silver is the best electrical conductor of any metal. Kitco's chart page records how solar panels grew into roughly a quarter of industrial silver demand over the past decade, alongside electronics, electric vehicles and medical uses. This is the assumption doing the heaviest lifting in most bullish five-year outlooks.
What this means for readers: a long-horizon silver forecast is partly an energy-transition forecast. If solar installation keeps expanding, the industrial floor under silver strengthens. If installation plateaus, or if thrifting and substitution reduce the silver intensity of panels, that floor weakens. Neither outcome is knowable five years out with confidence, which is precisely why responsible outlooks treat industrial demand as a scenario variable rather than a certainty.
Supply, Byproducts and the Deficit Question
The supply side of a five-year outlook is quieter but just as important. Because most newly mined silver is a byproduct of mining for other metals, silver supply responds slowly to silver prices. A higher silver price alone does not open silver mines, which can extend deficits when demand runs ahead of supply. Bullish outlooks lean on this: persistent deficits, they argue, should support prices over years, not quarters.
The counterweight is recycling and above-ground stocks. Silver held in bars, coins and ETFs can re-enter the market when prices incentivize it. A five-year projection that models mine supply but ignores the stock of investment-grade metal sitting in vaults has left out a large seller. Our analysis: read the supply section of any long-horizon outlook carefully. If it discusses byproduct constraints but not secondary supply, its deficit math is incomplete.
How to Read a Five-Year Silver Forecast: Practical Steps
A structured read turns a forecast from a number into a testable argument.
- Find the rate assumption. Every precious-metals forecast embeds a view on real interest rates and the dollar. Ask whether the author states it explicitly or hides it.
- Check the demand split. Does the outlook model industrial demand separately from investment demand? The two can move in opposite directions within the same year.
- Look for ranges. A point target for 2031 is decoration. A range with named scenarios is analysis.
- Watch the gold-silver ratio. Kitco puts the ratio near 79 — one ounce of gold buys about 79 ounces of silver. Forecasts that lean on mean reversion in the ratio are really forecasting relative performance, not absolute price.
- Separate price from return. Physical products trade at a premium above spot covering fabrication and distribution, and dealers' bid-ask spreads add a round-trip cost. A five-year price gain can be partly consumed by premiums and spreads on the way in and out.
For readers weighing how to hold any silver exposure at all, our comparison of Silver ETFs vs Physical Silver: What You Actually Own in Each covers the ownership differences that forecasts rarely address. The investing section carries our wider coverage of hard assets, and our near-term read sits separately in Silver Price Prediction 2026: What Analysts Expect Next.
What Remains Unknown
The evidence supports a structure, not a number. Silver's price is set by monetary drivers, an industrial demand base that now includes a large solar component, and a supply curve that moves slowly because of byproduct mining. Those are the levers every credible five-year outlook pulls. What no one can support is the path: the order and timing of rate moves, the pace of solar buildout, and the timing of investor flows, including retail waves like the 2021 "silver squeeze," which Kitco records as capable of moving the price sharply in a small market.
The practical takeaway for collectors and stackers is to treat five-year silver price predictions as organized opinions about those levers, useful for framing risk rather than for setting entry points. Anyone considering silver as part of a portfolio should weigh the volatility described above against their own horizon and consult a financial advisor, as APMEX advises in its own market materials.
Market note, as of the latest retrieved quotes: spot silver was indicated near $49.00 per troy ounce, down $3.04 on the day, with a session range of $48.74 to $53.13, and the gold-silver ratio near 79.1, per Kitco's live chart page. Quotes move nearly around the clock; verify current levels before acting.