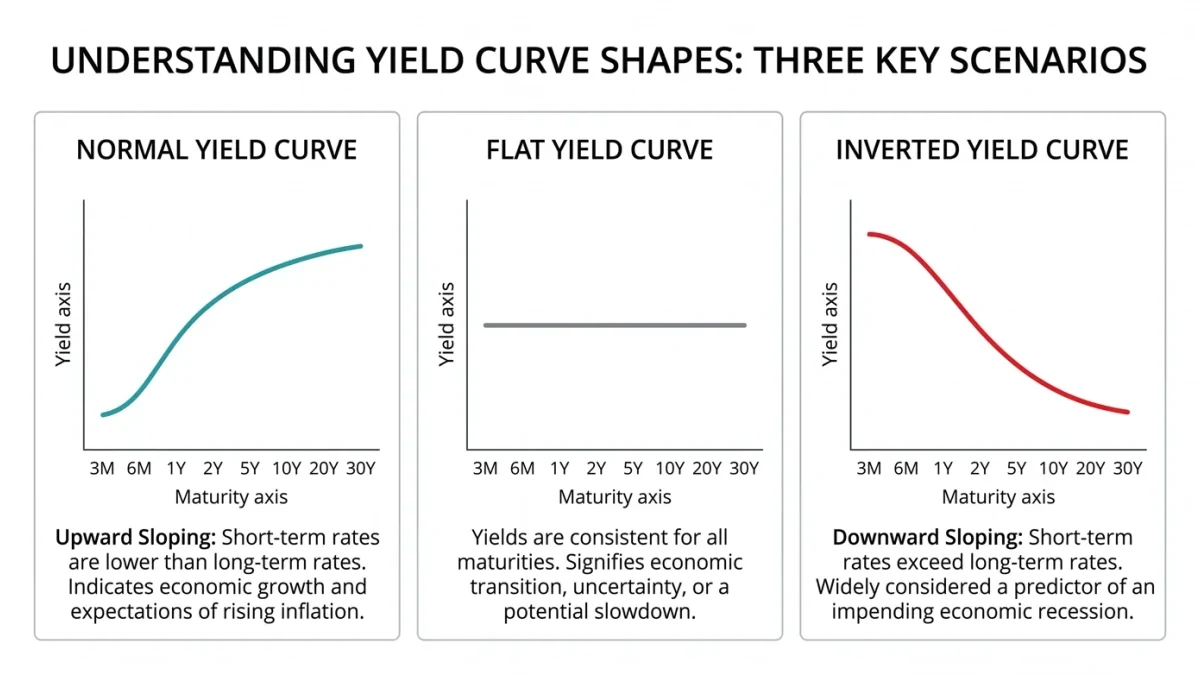

The silver futures price is a term quote, not a forecast. It prices a promise: silver delivered at a chosen month, in 5,000-ounce lots, through the CME Group exchange. Every listed month carries its own number. Read in order, those numbers form a curve, and the curve is the story.
The curve compares what silver costs for delivery now against later delivery. Gaps between months mostly reflect storage, financing and convenience. Traders call the gap between a futures month and the spot benchmark the basis. A silver futures price states terms of trade, not a poll about tomorrow. For related coverage, see Today's Silver Price: How the Quote Is Assembled From Auction to Dealer Spread.
The Contract Behind the Quote
The contract rules set the grammar. One lot covers 5,000 troy ounces. Prices quote in United States dollars and cents per troy ounce. Each one-cent move equals 50.00 dollars per lot. The product trades under the code SI.
Monthly contracts list 26 straight months, and July and December dates stretch the ladder out to 60 months. The session runs Sunday evening through Friday afternoon Eastern time, with a 60-minute break each day. The exchange prints prices without pause inside those hours. That stream feeds every chart, quote board and metals headline.
What the Silver Futures Price Curve Shows
Plot the months in order and the shape speaks. Deferred months above nearby months mark contango, the normal cost of carry. Carry is storage plus the cost of money. Nearby months above deferred months mark backwardation, a sign of tight supply for prompt delivery. Neither shape says where the price will go. Both shapes describe what the market charges for waiting. Steep ladders tell the story louder than flat ones.
As a contract nears its final trading day, the basis squeezes toward zero. That squeeze is built into the delivery terms. Curve readers watch the basis narrow or widen across the ladder. A flat curve has a message too, since lined-up months mean carry and convenience sit in balance.
The 0.001 Tick on Calendar Spreads
The outright minimum move is 0.005 per ounce, worth 25.00 dollars per contract. Calendar spreads between two months tick at 0.001, worth 5.00 dollars. The smaller step shows where the real news sits. Curve shape trades at a fifth of the outright step, because the shape is the tradable idea.
Spread trading also splits two bets. An outright position wagers on the level. A calendar spread wagers only on the link between two months. Many trading desks play the link and hedge the level away. One quote board shows both games in a single grid of numbers. The grid rewards a long look before any move.
Positioning: The Weekly Snapshot
The Commodity Futures Trading Commission adds a weekly layer. Its Commitments of Traders report lands most Fridays at 3:30 Eastern, built on Tuesday data. The report splits open interest into commercial and non-commercial groups. Metals sit in the exchange sections of the report family.
The family includes Legacy, Disaggregated and Traders in Financial Futures versions. Metals appear in the Disaggregated sections and the Legacy exchange lists. Analysts read the mix as context, never as a call on direction. Heavy speculative length can mark a crowded trade. Hedged commercial flow can mark real industrial demand. Neither line says which way the next session moves, and the data ages fast between Tuesdays. A Tuesday print read on a Friday moves slower than it looks.
Conclusion: Read the Curve at the Source
A five-minute check sharpens any curve story. Open the CME Group silver page and confirm the unit, the months and both tick sizes. Then write down the last prices of the first six listed months. The shape of that ladder, contango or backwardation, is what honest comment must match. That is how the silver futures price gives up its meaning. One page, six numbers, one shape: that is the whole drill. Six numbers in a column beat any headline about the curve.